A phase diagram shows the temperatures and pressures at which the various phases (i.e., solid, liquid and gas) of a substance can exist.
A phase diagram also shows the temperatures and pressures at which the various phases are in equilibrium.
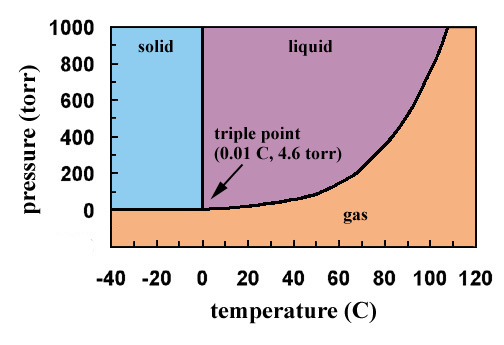
The phase diagram for water is shown below. The solid lines identify the temperatures and pressures at which an equilibrium exist between phases. The point at which the lines intersect represents the triple point. At the pressure and temperature of the triple point, all three phases (solid, liquid and gas) exist in equilibrium. The triple point for water occurs at a pressure of 4.6 torr and 0.01oC.
Click on the diagram to see a microscopic view of the phase(s) that exist for a given temperature and pressure.
|
At this temperature and pressure, solid and liquid water exist in equilibrium. A microscopic view is shown below.
|
If the figure were large enough, the line representing the temperatures and pressures at which liquid and gaseous water are in equilibrium would terminate at a temperature of 374oC and a pressure of 165,500 torr, the critical temperature and pressure of water.
Beyond the critical temperature, liquid and gaseous water cannot be in equilibrium because liquid water cannot exist above the critical temperature.