Welcome to the Ben-Amotz Research Group!
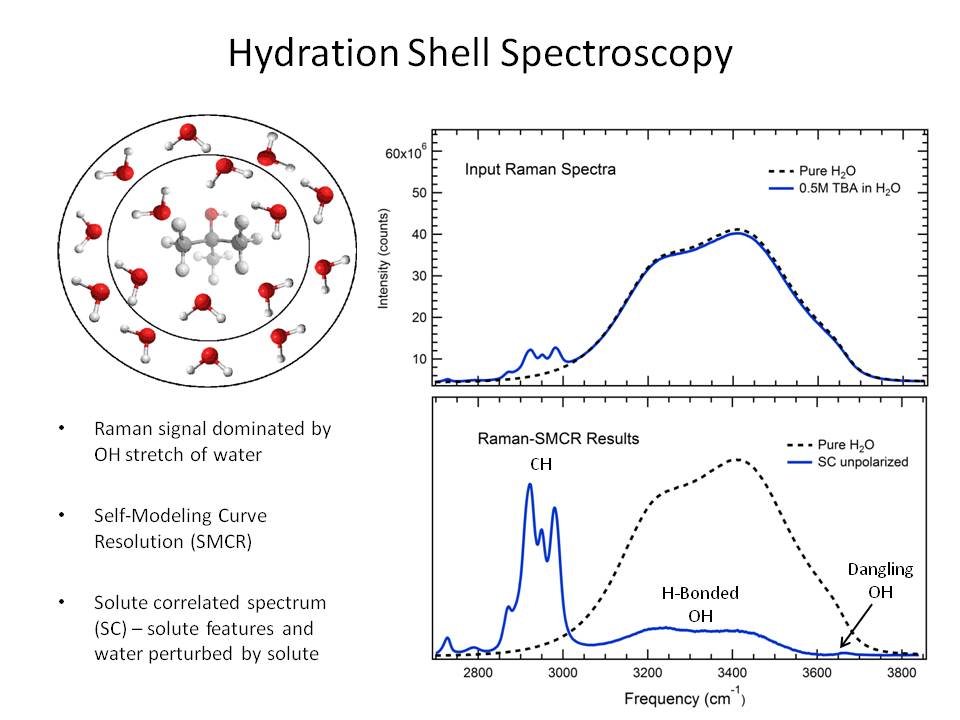
Hydration Shell Spectroscopy
Water is an interesting substance of great biological importance. Hydrophobic hydration has been identified as a key mediator - and often instigator - of various aqueous biological activities, including protein folding. Understanding hydrophobic hydration is the cornerstone to understanding these activities. To this end, our research focuses on studying aqueous solutions of hydrophobic molecules using Raman-SMCR. Raman-SMCR is a technique that combines Raman spectroscopy with Self-Modeling Curve Resolution (SMCR) and similiar deconvolution techniques. This enables us to decompose experimental spectra into solute correlated (SC) and solvent components. The SC components contain features from the solute itself, such as the C-H and C-C vibrational bands, as well as the water molecules perturbed by the solute. This allows us to see unique features not previously seen within the liquid phase of water, such as dangling (or "free") OH bonds at the molecular level. Our current projects focus on hydrophobic association, protein solvation, and ion affinity for molecular oil/water interfaces.
Compressive Detection
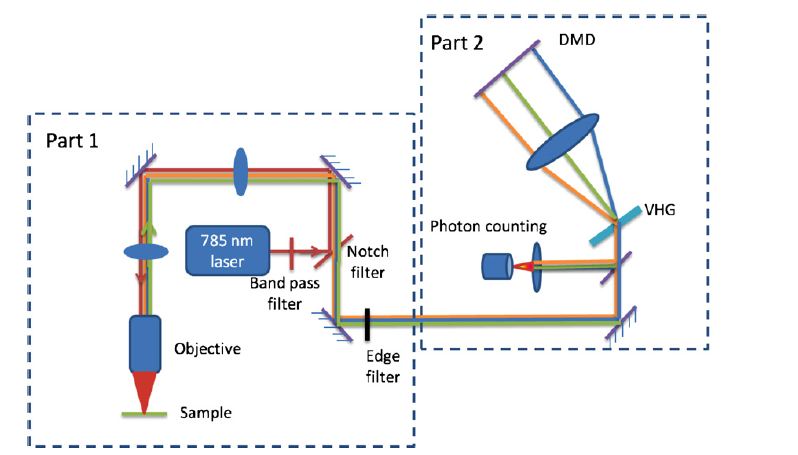
We have developed an instrument designed for compressive detection imaging, which allows us to collect data much faster than conventional Raman spectroscopy - milliseconds vs. minutes or hours - without sacrificing resolution and image quality. Thus, we are able to rapidly distinguish different chemical components in biological samples, pharmaceuticals, and engineering materials. Fast imaging of this nature has broad applications, from medical diagnostics to industrial process monitoring to kinetic studies. The figure below shows a schematic of the Digital Micromirror (DMD)-based near infrared digital compressive detection instrument.
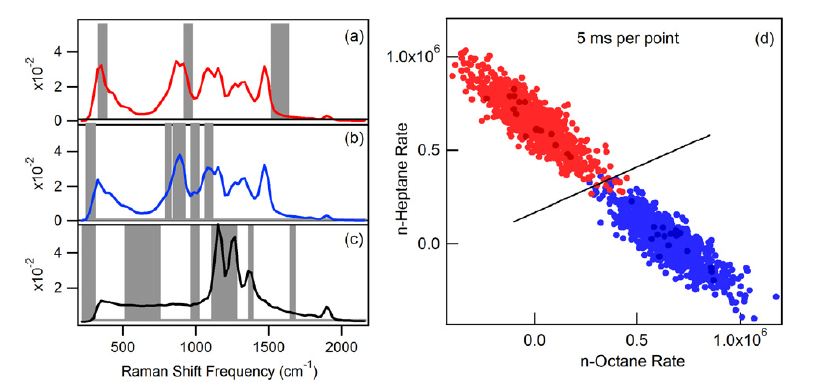
Compressive Detection allows the classification of highly overlapping spectra. The Raman spectra of n-heptane (plus background), n-octane (plus background), and the background are shown in panels (a)-(c), respectively. The shaded regions denote the wavelengths directed toward the detector, as determined by the optimal binary (OB) filters. The score plot in panel (d) shows the classification of n-heptane (red) and n-octane (blue) using a linear discriminant. Each point was obtained using three OB filters applied for a total integration time of 5 ms. The darkness of each colored disk represents the number of times each pair of photon rates was obtained in 1000 independent measurements (per cloud). The lightest disks indicate one result each, and the darkest disk for both n-heptane and n-octane indicates 2 results.
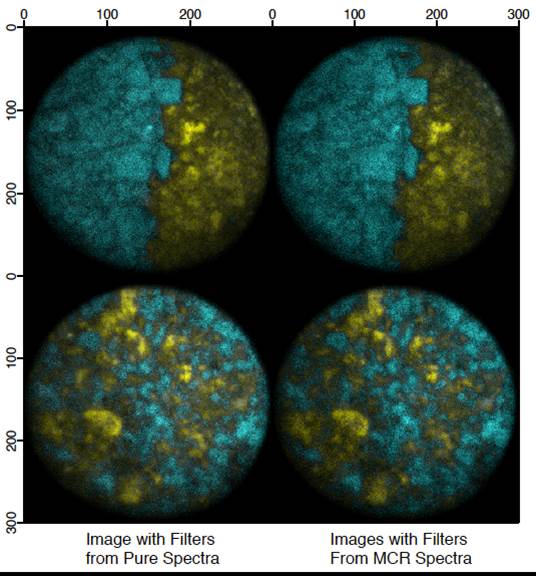
The figure below compares images of fructose (yellow) and glucose (cyan) obtained using two different methods for finding OB compressive detection filters. The two left-hand images were obtained using filters derived from directly measured (and background-subtracted) pure component spectra. The two right-hand images were obtained using MCR-derived component spectra. The latter method does not require that pure samples are available, as pure component spectra are extracted from spectra obtained from a small number of randomly selected points within the sample of interest. All of the images were acquired with an integration time of 1 ms per pixel.