Figure 1
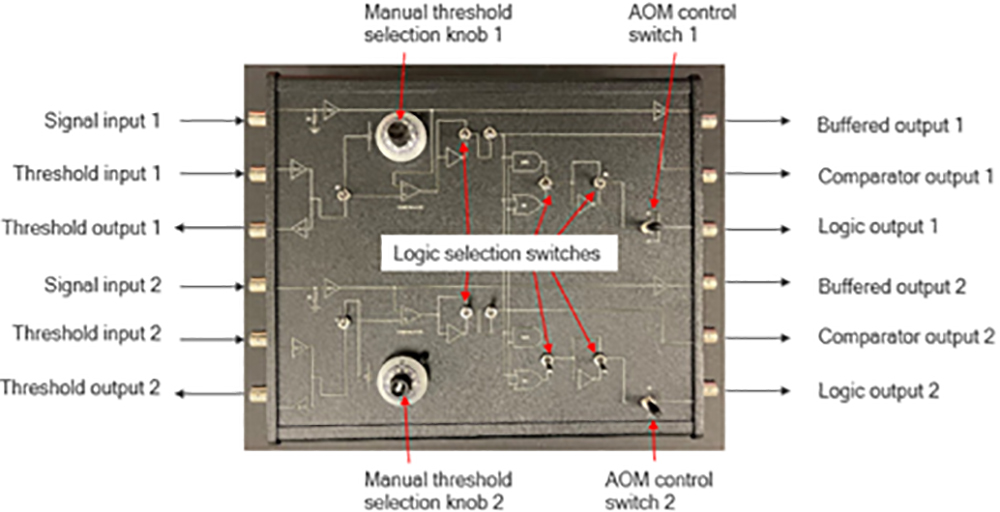
Figure 2
Florescence Imaging System
The Need:
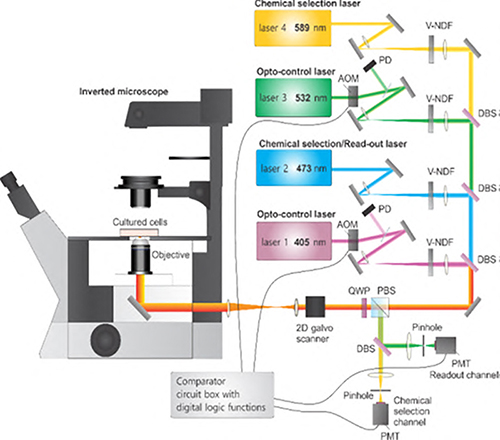
Professor Zhang’s laboratory uses scanning confocal fluorescence microscopy to study sub-cellular processes with perturbations. In addition to techniques such as Fluorescence Recovery After Photobleaching (FRAP) and optical manipulations with organelles under sub-cellular level, the lab focuses on developing new techniques to enhance the specification and precision of the optical manipulation processes. Recent advances in the lab have required more precise laser illumination control to overcome/avoid issues such as photobleaching from over exposure. Such measurements require precise beam positioning and illumination on the sample by multiple lasers. As sample conditions with real samples have become more complex (i.e., more fluorescence protein labels and photodamage due to the specific light-protein interaction), the need for a flexible control system to synchronize system components in a manner which allows researchers to adapt optical treatments on the fly emerged.
The Solution
In an ongoing collaboration, members of the Amy Facility and Zhang lab have developed an imaging control/measurement system which allows users to easily specify spatial (XY) and wavelength imaging conditions coupled with real-time signal level discrimination treatment selectivity to conduct highly customizable cell activity investigations. At the heart of the system is the control of two mirrors steering multiple colinear lasers to image the sample. (Figure 1) During mirror scanning, actions of other optical components are synchronized to control which illumination source(s) impinge on the sample at any given location. In this way, preselected regions of interest (ROI) such as cell organelles or an independent pattern can be investigated during a scan. The software written by Mike Everly allows complete control over image size, resolution, and data channel(s) sampling conditions. It also allows users to select regions of interest (ROI), such as cell organelles, and create a mask specifying illumination conditions for activating dyes or photo-bleaching these pixels in the image. In some experiments, it is necessary to determine when a sample should be or not be exposed to additional illumination based on current signal levels. This level of real-time signal level discrimination of treatment specificity is achieved with custom electronic hardware developed by Mark Carlsen. Optical system construction and image collection was done by Bin Dong.
The Result

Example 1: Photobleaching with user defined digital mask
The images in Figure 3 demonstrate using the digital mask capabilities to photo bleach a desired pattern on a sample. Image 3a is that of a fluorescence beads suspension imaged with a 473 nm laser with no masking or additional optical treatment. As expected, it generates a uniform fluorescence image. Figure 3b is a user defined digital mask specifying which areas of the sample will be illuminated (i.e. treated) with a 405 nm laser to photo bleach the sample. Figure 3c is the image of the sample during the optical treatment with the 405 nm laser, which will induce further photobleaching to the beads. The brighter pattern shows the signal enhancement from treatment. Figure 3d shows the beads image after the treatment, the PURDUE logo shows darker signals than untreated regions. The result shows high precision and selection of the treatment by using the software.
Example 2: Signal enhancement within live cells to highlight microtubules in real time
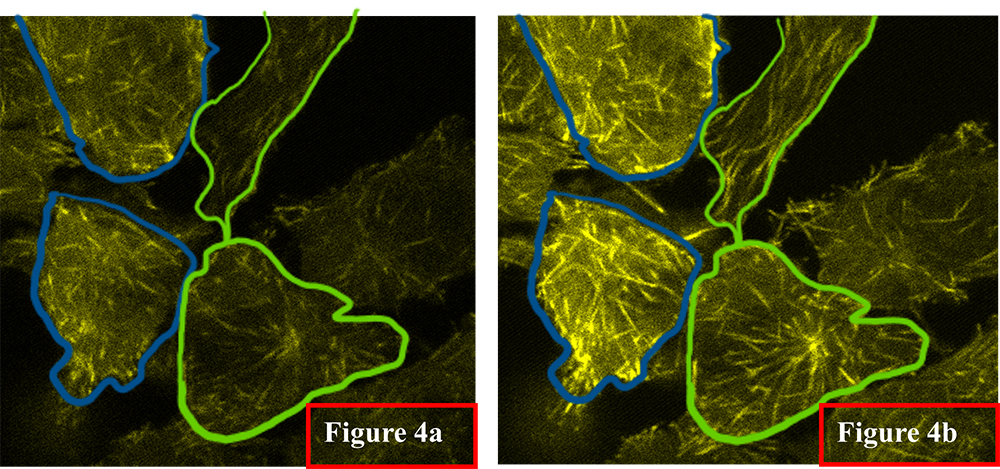
In this example, Eb3-EGFP cells expressing enhanced green fluorescent proteins (EGFP) which preferentially bind to microtubules are used to demonstrate the region of interest selection and optical treatment enhancements used to gain insights into activities of living cells. Figure 4a shows an image of four cells. The 473 nm laser was used to excite EGFP to obtain this initial image. Using the program Mask Creation feature, the user has highlighted two groups of cells for further optical treatment. The cells outlined by the blue line will be treated with additional 405 nm light which preferentially increases emission from EGFP bound to microtubules. Those cells highlighted with a green outline will be treated with 532 nm light. There is no fluorescence protein that can be excited by 532 nm laser in the current sample, thus there is no signal enhancement within these regions. This example demonstrates the ability to select multiple regions of interest in an image and subject them to different optical treatments in real time. Figure 4b shows the outcome of the two different optical treatments during a single image scan. The cells outlined in green show intensity enhancement and finer structural detail than the cells illuminated with additional green light. It was also necessary to use the (RPOC) box in these images to selectively expose cells above a certain signal level (i.e. those not photo bleached) to ensure signal uniformity and improve contrast.
Videos
Amy Facility Collaboration in Imaging System Development
Using Laser to Control Chemical Reactions in Cells in Real-time
Purdue Article
Purdue technology provides site- and chemical-specific control of processes within live cells
| Research Group | Chi Zhang, Chemistry |
| Lab Contact | Bin Dong, Chemistry |
| Amy Contact |
Mike Everly, Chemistry |
- A Look Inside the Amy Facility
- Optical Stimulator
- Hot Plate Photoreactor
- Modular Low-Cost Photoreactor Chamber
- Pulse Stretching Amplifier
- Florescence Imaging System
- Linear Rail Fatigue Tester
- Spherical Void Electrodynamic Levitator
- Mass Spec Solids Probe
- Cold Ion Spectroscopy
- Photomultiplier Tube Power Supply
- Cryogenic Cooling Stage
- Carbon Fiber Tubing
- Coiled Tubing Reactor
- E-Beam Project
- TRAC
- Flow Reactor
- Triboluminescence
- Vertical Air Profiler
- Argos Data Collector
- ALAR
- O'Buoy Project
- Microsecond Raman imaging might probe cells, organs for disease
- High Bandwidth 16-Channel PMT Amplifier
- RCF Controller
- Photochemical Reactor
- Apple Pencil Charger
- 8-Channel RF Signal Generator